Following the previous post about Beech Leaf Disease, I have continued collection of
environmental data and begun acquisition of imagery from UAV drones to explore
the continuing effects of BLD on the forest in the north woodlot of University
Farm. The purpose of this post is to
report preliminary observations about the lack of a discernable effect of BLD
on the upper canopy of the forest and to update observations of BLD incidence
in 2018.
The BLD incidence in University Farm’s north woodlot in 2018 was similar to observations in 2017. Figure 1 illustrates the same diminished leaf growth in the secondary canopy of the north woodlot observed in 2017. Figure 2 is a close up view of the effect of BLD on beech leaves, showing the characteristic darkening of the area between leaf veins. Later the number of leaves showing the effects of BLD will increase and the leaves eventually shrivel and drop off.
 |
|
Figure 1. Openness of
the secondary canopy in late June 2018 in a beech dominated area of the north
woodlot of Case Western Reserve University’s University Farm. The photo is north facing in the vicinity of
the north woodlot weather station.
|
 |
|
Figure 2. Close up
view of infected beech leaves in the secondary canopy of the north woodlot of University
Farm.
|
As in 2017, the light levels in the beech dominated area of
the north woodlot increased relative to the levels prior to 2017. The ratio of forest incident solar radiation
to open field solar radiation remained about double the levels in June to
September of 2015 and 2016 (Figure 3).
 |
|
Figure 3. Ratio of
forest to open field incident daily-averaged solar radiation observed at
weather stations in University Farm.
|
I monitored upper canopy foliage changes with two drone platforms. The DJI Phantom 3 Standard drone used in 2017 had a 12 megapixel camera with Red, Green, and Blue color bands. The DJI Inspire 2 drone used in 2018 carried either a 20 megapixel, Zenmuse X4s camera or a Sentera Double 4K Multispectral sensor. Both the Phantom 3 camera and the Zenmuse X4s take true color images using red, green, and blue color bands. The Sentera sensor has two cameras. One camera captures narrow red, green, and blue color bands, and the other has red edge and a near infrared color bands. University Farms’ Facebook page has links to two short videos (Link 1 and Link 2) about the use of the Inspire drone and its cameras. This post summarizes some of initial findings from examination of individual images. Future posts will more fully document collection, processing, and analysis of the imagery.
Drone mounted cameras and sensors provide detailed views of the canopy structure and leaf condition in the north woodlot. I first focus on the imagery of the upper canopy near the north woodlot weather station where the effects of BLD on the secondary canopy are most clear (see Figure 1). Figures 4 and 5 show a portion of the north woodlot with an area of leaf damage in the upper canopy of a beech tree (highlighted by a red outline). Damage in 2017 (Figure 4) seems less severe 15 months later (Figure 5). Figure 6 and 7 are enlarged views of the red outline areas in Figures 4 and 5. In Figure 6, the leaves appear sparse, under developed, and yellowed. BLD infected leaves in the secondary canopy, in contrast are thickened and darker than uninfected leaves. It thus seems unlikely that this type of damage is the result of BLD.
Drone mounted cameras and sensors provide detailed views of the canopy structure and leaf condition in the north woodlot. I first focus on the imagery of the upper canopy near the north woodlot weather station where the effects of BLD on the secondary canopy are most clear (see Figure 1). Figures 4 and 5 show a portion of the north woodlot with an area of leaf damage in the upper canopy of a beech tree (highlighted by a red outline). Damage in 2017 (Figure 4) seems less severe 15 months later (Figure 5). Figure 6 and 7 are enlarged views of the red outline areas in Figures 4 and 5. In Figure 6, the leaves appear sparse, under developed, and yellowed. BLD infected leaves in the secondary canopy, in contrast are thickened and darker than uninfected leaves. It thus seems unlikely that this type of damage is the result of BLD.
 |
|
Figure 4. Copy of a
jpeg image from the DJI Phantom 3 Standard color camera on July 24, 2017 in the
vicinity of the north woodlot weather station.
The photo was taken at 45 m altitude.
The area outline in red shows evidence of leaf damage in the upper
canopy.
|
 |
|
Figure 5. Photo taken
on September 17, 2018 at the same location as in Figure 4, in the vicinity of the
north woodlot weather station. Image
taken with a DJI Phantom 3 standard camera at an altitude of 45 m. Area highlighted with a red outline is the same
as the area outline in Figure 4.
|
 |
|
Figure 6. Closer look
at canopy damage in the red outline area of Figure 4 from July 24, 2017. Damage is to part of the canopy of a beech
tree showing diminished leaf grow. The
affected leaves do not seem to show the characteristic thickening of BLD
infected leaves.
|
 |
|
Figure 7. Close up of
red outlined area in Figure 5 taken on September 14, 2018. The close up is directly comparable to the
image in Figure 6 and shows general recovery and possible loss of canopy
structure a year after the damage viewed in Figure 5.
|
Because the drone imagery
provides an overview of the entire north woodlot, it is possible to check more systematically for
patterns of upper canopy damage. A wide
variety of vegetation indices have proven useful in vegetation surveys for
agriculture and forestry, and I began to explore using some of these indices to
identify potential BLD effects. I next
focus on the results from the TGI and NDRE vegetation indices. I chose these two indices because they use
light bands from each of the two cameras on the Sentera Double 4K Multispectral
Sensor that I mount on the DJI Inspire 2 drone.
The spectral bands are, Blue (446nm x 60nm width), Green (548nm x 45nm width), Red (650nm x 70nm width), Red Edge (720nm x 40nm width) and Near Infrared
(840nm x 20nm width). The two vegetation
indices (calculated for each pixel in the image are as follows:
TGI
= Green - 0.39*Red -0.61*Blue
NDRE
= (NIR – RE)/(NIR + RE)
Using an R script with the rgdal and gdalUtils libraries, I
transformed each drone image into a GeoTiff raster for each vegetation index
and sampled the mean value of the vegetation index from the raster values
within a 1.5 m radius circle centered on a sample point in a set of specified sample
locations. Creating a regularly
distributed set of 200 sample points for the north woodlot provided a standard
way to analyze both spatial and temporal variability of the indices. Figure 8 shows that the two indices are
inversely correlated with a highly significant correlation coefficient of 0.64
and an RSQ value of 0.406.
 |
|
Figure 8. Scatter
plot of the association of the mean NDRE and mean TGI vegetation indices for
two hundred sample locations in the north woodlot. The correlation had an RSQ value of 0.41 and
was significant at the 0.001 level. Also
shown is the regression in blue and standard error band in grey.
|
 |
| Figure 9. Temporal variability of mean TGI values in three types of areas of the north woodlot at University Farm. Results are for five spatially defined areas (2 Beech, 1 Beech plot used by Holden Arboretum for fertilizer application, and 2 non-beech). |
 |
|
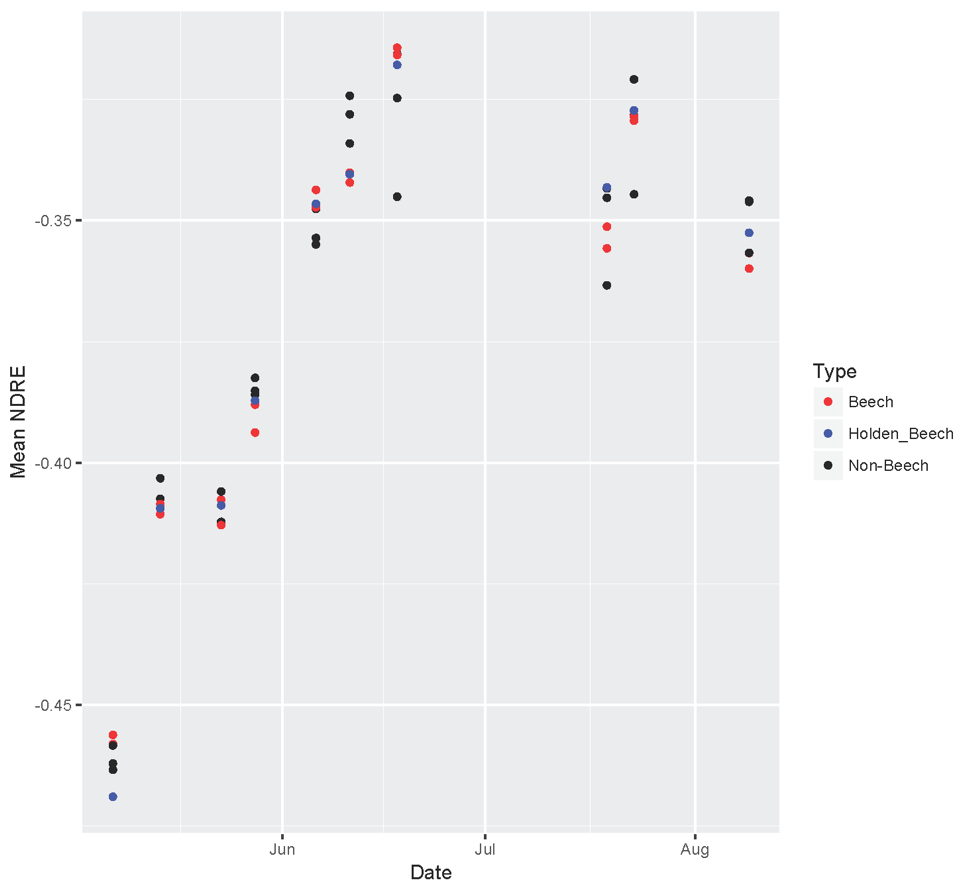
Figure 10. Temporal
variability of mean NDRE values in three types of areas of the north woodlot at
University Farm. Results are for five
spatially defined areas (2 Beech, 1 Beech plot used by Holden Arboretum for
fertilizer application, and 2 non-beech).
|
 |
|
Figure 11. Changes in
ratio of north woodlot to open field incident solar radiation for the period
May 1 to August 31, 2018.
|
Conclusion
Despite the major effect of BLD on beech trees in the
secondary canopy of the north woodlot and the increases in incident solar
radiation relative the a 2010 to 2016 baseline, it appears that BLD has had
much less effect on the upper canopy.
Existing changes of upper canopy structure (damaged foliage or standing
dead trees) seems a continuation of long-duration stress on beech. Leaf irradiance indices also show little
evidence of a specific change in upper canopy beech leaf color or area that we
would expect with the changes seen in secondary canopy beech (see Figure 2).
No comments:
Post a Comment
Note: Only a member of this blog may post a comment.